Real-Time Workforce Analytics for Every Leader
From CHRO to line manager — pre-built dashboards and a no-code studio for every people decision.
- 100+ pre-built dashboards
- No-code analytics studio
- Predictive attrition modelling
- DEI dashboards
- Cost per hire & per FTE
- Export to BI tools
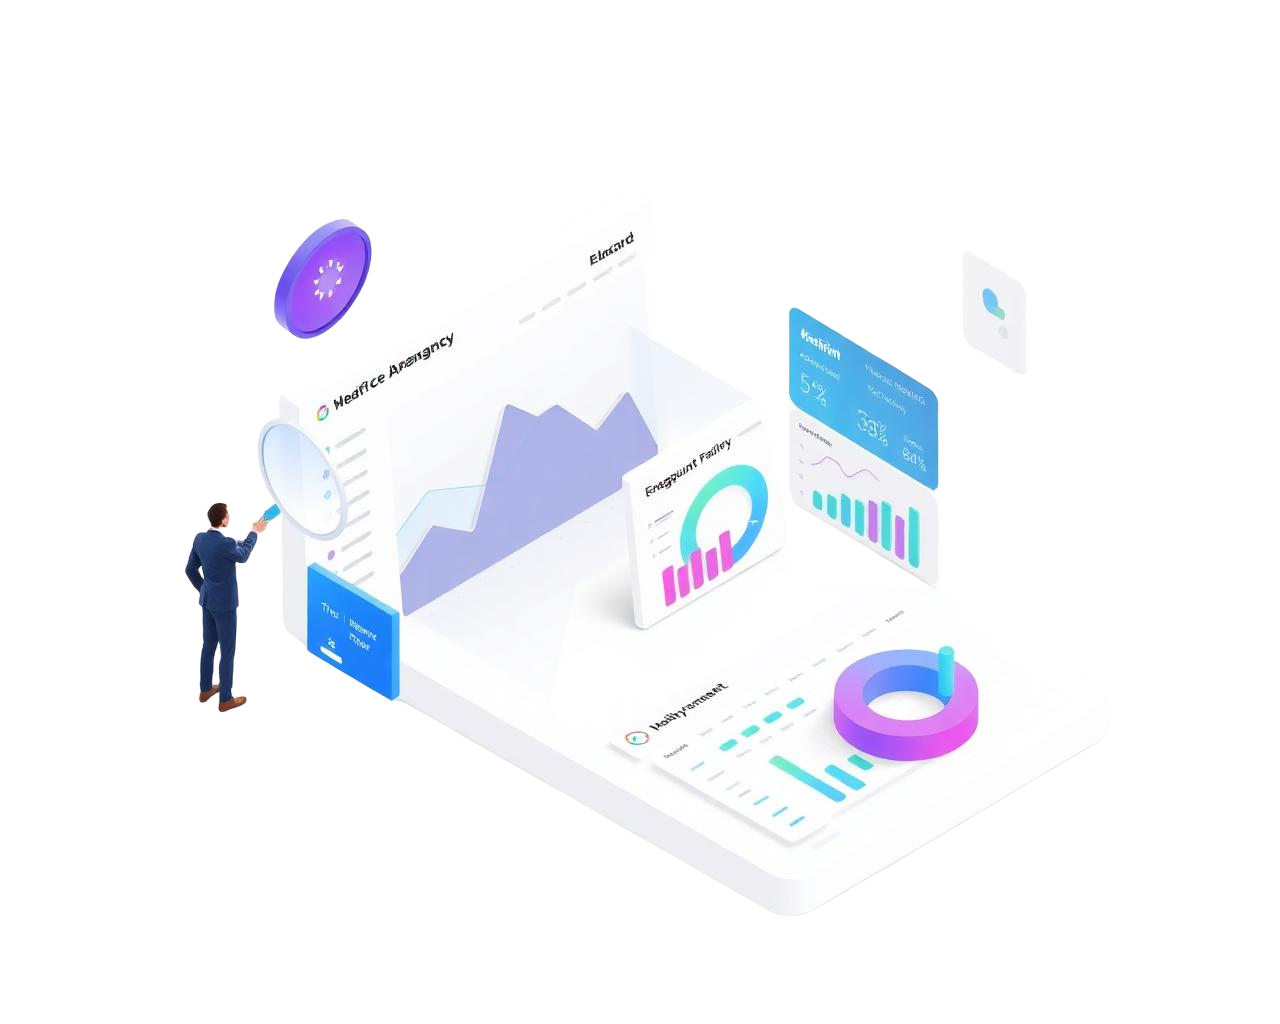
A complete overview of the Workforce Analytics module
Radix Workforce Analytics turns every people decision into a data-driven one. 100+ pre-built dashboards and a no-code analytics studio give every leader — from CHRO to line manager — real-time visibility into headcount, hiring, performance, learning, engagement, DEI and cost. Data flows live from every Radix module without ETL, predictive models surface what is about to happen, and BI connectors push curated datasets into your warehouse for advanced analysis.
Business problems this module solves
If any of these sound familiar, you are paying the cost of a missing platform — in time, money and employee trust.
Static HR reports
Monthly PDF reports answer last month's questions and never the new ones leaders are asking now.
Data silos
Hiring, payroll, performance and learning data live in separate systems with no shared definitions.
No predictive view
Reporting tells leaders what happened; nothing tells them what will happen next.
BI dependency
Every question turns into an IT ticket and a six-week BI build with stale conclusions by delivery.
Key features of Workforce Analytics
Pre-Built Dashboards
100+ ready dashboards across headcount, hiring, performance, learning and cost.
Analytics Studio
Drag-and-drop studio to build any chart, table or pivot in minutes.
Predictive Models
Predict attrition, hiring success and engagement with explainable AI.
DEI Analytics
Diversity, representation, pay-equity and inclusion dashboards.
Benchmarking
Compare against industry benchmarks for hiring, attrition and cost.
BI Connectors
Stream data to Tableau, Power BI, Looker and your data warehouse.
CHRO Cockpit
How it works
Business benefits & ROI
Quantifiable outcomes enterprise teams typically see after rolling out this module.
Self-serve dashboards collapse insight cycles from weeks to hours.
Live data from every module ends definitional debates across HR functions.
Attrition, engagement and hiring models surface what is coming, not what has happened.
Curated datasets stream into your warehouse with row-level security intact.
Industries using this module
CHRO Cockpit
Real-time view of every people KPI for the board.
Attrition Hotspots
Identify teams at risk and trigger retention interventions.
DEI Reporting
Quarterly DEI reports with goals, gaps and progress.
Works with the tools you already run
Frequently asked questions
Can I build custom dashboards?
Yes. The no-code studio supports any chart, table, pivot, KPI and filter — saved per role.
How accurate are the predictive models?
Attrition models achieve 80%+ precision on rolling validation across customer datasets with explainability.
Can I export data to my warehouse?
Yes. Streaming and batch connectors for Snowflake, BigQuery, Databricks, Redshift and S3/Azure Blob.
Is row-level security supported?
Yes. RLS enforces who can see which data based on org structure, role and custom rules.
Can dashboards be personalised by role?
Yes. Every role sees a tailored homepage with relevant dashboards, KPIs and filters — with row-level security enforcing what data they can see.
Does Radix support scheduled reports?
Yes. Subscribe stakeholders to scheduled email or Slack digests of any dashboard with filters, comments and exports.
Can we embed Radix dashboards in our intranet?
Yes. Embed dashboards with secure tokens and white-labelled UI inside any internal portal or executive cockpit.
How does row-level security work?
RLS rules are defined per role, org branch or custom logic and apply uniformly to dashboards, studio queries and BI exports.
Related platform modules
Decide with data, not opinions
Real-time workforce analytics for every leader, on every device.